z-test and t-test (R)
Introduction
Z test and t test are used when a claim is made about the population parameter such as population mean or proportion. If the population variance is known, Z-test is used while t test is used when the population variance is unknown.
I will try to explain it using a problem that I faced recently.
In the below example, I will use a sample from my attendance data set described in EDA blogs. (Actual data is not shown for security reasons. This is mock data which is very similar to the actual one. The analysis will be the same)
Hypothesis
My manager claims that I always leave early from office. I have to disprove his claim and prove that I always leave at least 10 minutes after my policy out-time.
I want to prove with 95% confidence interval that I leave on an average at least 10 minutes after my policy out-time. My null and alternate hypothesis will be.
$$ H_0: μ_{diff.out.time} <= 10 $$ $$ H1: μ_{diff.out.time} > 10 $$
I know that the standard deviation of my population (out-time difference) is 1 hour. As I know the population standard deviation, I can conduct the z-test.
Z-test
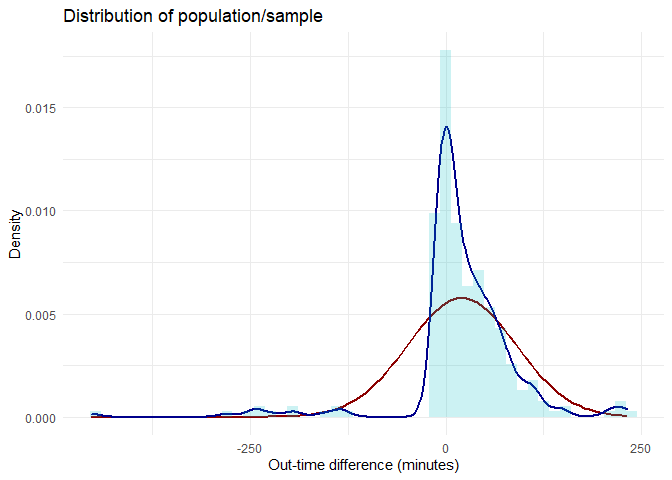
Although the distribution of the population or that of the sample is not normally distributed, from CLT I know that the sampling distribution will be normally distributed with the same mean as the population mean.
The mean of the sample is
## x_bar = 20.3227
I will thus conduct a z-test with μ = 10, σ = 60, n = 282 and x̅ = 20.32
# Functions used for z-test

z.test.pop = function(data_list, pop.mean, pop.sd, alternative){
  # Function for finding z and p value
  z.score <- (mean(data_list)-pop.mean)/(pop.sd/sqrt(length(data_list)))

  is.left <- if_else(alternative %in% c('two.tailed', 'less'),TRUE,if_else(alternative == 'greater', FALSE, NA))
  one.tail.p <- pnorm(z.score,lower.tail = is.left)
  cat("z-value is: ",z.score,"\n")
  cat("p value is:", one.tail.p,"\n")
}
plot_z_hypothesis <- function(data_list, pop.mean=0, pop.sd=1, alternative = 'two.sided', alpha = 0.05,
                              label = 'Sampling distribution',title = 'z-test'){
  # Finding population mean
  x_bar <- mean(data_list)
  n <- length(data_list)

  # Creating a sample normal distribution
  range <- seq(pop.mean - 4*pop.sd/sqrt(n), pop.mean + 4*pop.sd/sqrt(n), by = (pop.sd/sqrt(n))*0.001)
  norm.dist <- data.frame(range = range, dist = dnorm(x = range, mean = pop.mean, sd = pop.sd/sqrt(n))) %>%
    dplyr::mutate(H0 = case_when(alternative == 'two.sided' ~ if_else((range <= qnorm(p = 1-alpha/2,
                                                                                      mean = pop.mean,
                                                                                      sd = pop.sd/sqrt(n),
                                                                                      lower.tail = TRUE)) &
                                                                        (range >= qnorm(p = 1-alpha/2,
                                                                                        mean = pop.mean,
                                                                                        sd = pop.sd/sqrt(n),
                                                                                        lower.tail = FALSE)),
                                                                      'Retain', 'Reject'),
                                         alternative == 'greater' ~ if_else(range <= qnorm(p = 1-alpha,
                                                                                           mean = pop.mean,
                                                                                           sd = pop.sd/sqrt(n),
                                                                                           lower.tail = TRUE),
                                                                            'Retain', 'Reject'),
                                         alternative == 'less' ~ if_else(range >= qnorm(p = 1-alpha,
                                                                                        mean = pop.mean,
                                                                                        sd = pop.sd/sqrt(n),
                                                                                        lower.tail = FALSE),
                                                                         'Retain', 'Reject')))
  # Plotting sampling distribution and x_bar value with cutoff
  ggplot(data = norm.dist, aes(x = range,y = dist)) +
    geom_area(aes(fill = H0)) +
    scale_color_manual(drop = TRUE, values = c('Retain' = "#00BFC4", 'Reject' = "#F8766D"), aesthetics = 'fill') +
    geom_vline(xintercept = x_bar, size = 2) +
    geom_text(aes(x = x_bar, label = paste0('x_bar = ', round(x_bar,3)), y = mean(dist)), colour="blue", vjust = 1.2) +
    labs(x = label, y='Density',  title = title) +
    theme_minimal()+theme(legend.position="bottom")
}
z.test.pop(data_list = attendance$diff.out.time, pop.mean = 10, pop.sd = 60, alternative = 'greater')
## z-value is:  2.889125
## p value is: 0.001931575
plot_z_hypothesis(data_list = attendance$diff.out.time, pop.mean = 10, pop.sd = 60, alternative = 'greater',
                  title = 'Out time difference (minutes)')
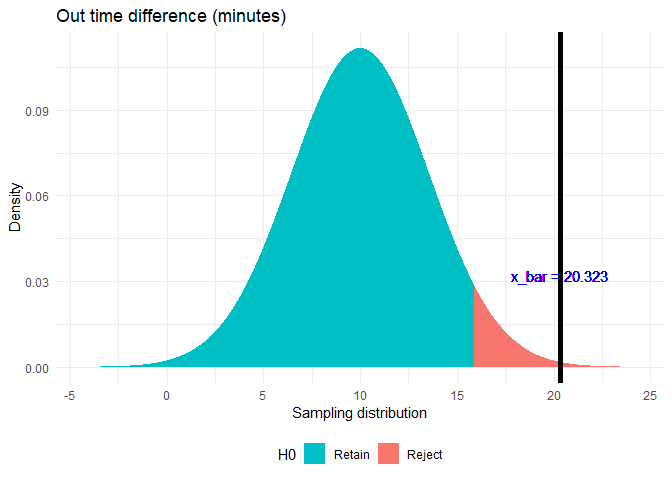
As p < α, where α = 0.05. Hence, rejecting the Null Hypothesis. Thus, the claim that difference of out time is less than 10 minutes is false.
T-test
But my manager is smart. He does not trust the population standard deviation of 1 hour.
The standard deviation of the sample is:
## sd = 69.06549
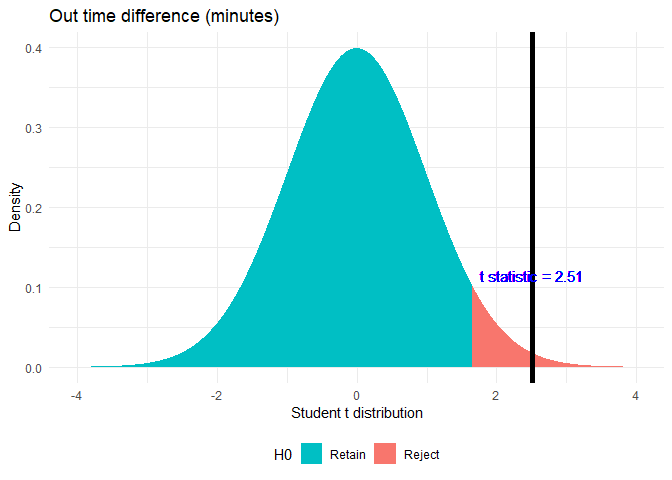
I will thus conduct a t-test with μ = 10, n = 282 and x̅ = 20.32
# Functions used for t-test

t.plot <- function(pop.mean=0, alternative = 'two.sided', alpha = 0.05, t.score, df,
                              label = 'Student t distribution',title = 't-test'){
  # Creating a sample normal distribution
  range <- seq(pop.mean - 4, pop.mean + 4, by = 0.001)
  t.dist <- data.frame(range = range, dist = dt(x = range, ncp = pop.mean, df = df)) %>%
    dplyr::mutate(H0 = case_when(alternative == 'two.sided' ~ if_else((range <= qt(p = 1-alpha/2,
                                                                                      ncp = pop.mean,
                                                                                      df = df,
                                                                                      lower.tail = TRUE)) &
                                                                        (range >= qt(p = 1-alpha/2,
                                                                                        ncp = pop.mean,
                                                                                        df = df,
                                                                                        lower.tail = FALSE)),
                                                                      'Retain', 'Reject'),
                                         alternative == 'greater' ~ if_else(range <= qt(p = 1-alpha,
                                                                                           ncp = pop.mean,
                                                                                           df = df,
                                                                                           lower.tail = TRUE),
                                                                            'Retain', 'Reject'),
                                         alternative == 'less' ~ if_else(range >= qt(p = 1-alpha,
                                                                                        ncp = pop.mean,
                                                                                        df = df,
                                                                                        lower.tail = FALSE),
                                                                         'Retain', 'Reject')))
  # Plotting sampling distribution and x_bar value with cutoff
  ggplot(data = t.dist, aes(x = range,y = dist)) +
    geom_area(aes(fill = H0)) +
    scale_color_manual(drop = TRUE, values = c('Retain' = "#00BFC4", 'Reject' = "#F8766D"), aesthetics = 'fill') +
    geom_vline(xintercept = t.score, size = 2) +
    geom_text(aes(x = t.score, label = paste0('t statistic = ', round(t.score,3)), y = mean(dist)), colour="blue", vjust = 1.2) +
    labs(x = label, y='Density',  title = title) +
    theme_minimal()+theme(legend.position="bottom")
}
t_soln <- t.test(attendance$diff.out.time,mu = 10, alternative = 'greater')
t.plot(t.score = t_soln$statistic, df = t_soln$parameter, alternative = 'greater',
                  title = 'Out time difference (minutes)')
print(t_soln)
##
##  One Sample t-test
##
## data:  attendance$diff.out.time
## t = 2.5099 mins, df = 281, p-value = 0.006319 mins
## alternative hypothesis: true mean is greater than 10
## 95 percent confidence interval:
##  13.53538 mins      Inf mins
## sample estimates:
## Time difference of 20.3227 mins
As p < α, where α = 0.05. Hence, rejecting the Null Hypothesis. Even by doing a t-test, I am rejecting the null hypothesis.