Null Value Imputation (R)
Problem
Real world data is not always clean. Its often messy and contains unexpected/missing values. In this post I will use a non-parametric algorithm called k-nearest-neighbors (KNN) to replace missing values.
Data
The data is technical spec of cars. I have taken this data set from UCI Machine learning repository which in turn took it from StatLib library which is maintained at Carnegie Mellon University. The data set was used in the 1983 American Statistical Association Exposition.
| mpg | cylinders | displacement | horsepower | weight | acceleration | year | origin | name |
|---|---|---|---|---|---|---|---|---|
| 20.0 | 6 | 156 | 122 | 2807 | 13.5 | 73 | 3 | toyota mark ii |
| 37.7 | 4 | 89 | 62 | 2050 | 17.3 | 81 | 3 | toyota tercel |
| 15.5 | 8 | 304 | 120 | 3962 | 13.9 | 76 | 1 | amc matador |
| 23.0 | 4 | 120 | 97 | 2506 | 14.5 | 72 | 3 | toyouta corona mark ii (sw) |
| 30.7 | 6 | 145 | 76 | 3160 | 19.6 | 81 | 2 | volvo diesel |
The data set contains the following columns:
1. mpg: continuous (miles per gallon)
2. cylinders: multivalued discrete 3. displacement: continuous (cu. inches)
4. horsepower: continuous
5. weight: continuous(lbs.)
6. acceleration: continuous (sec.)
7. model year: multivalued discrete (modulo 100)
8. origin: multivalued discrete (1. American, 2. European, 3. Japanese)
9. car name: string (unique for each instance)
Now I want to find if this data set contains any abnormal values.
summary(cars_info)
##       mpg          cylinders      displacement     horsepower        weight
##  Min.   : 9.00   Min.   :3.000   Min.   : 68.0   Min.   : 46.0   Min.   :1613
##  1st Qu.:17.50   1st Qu.:4.000   1st Qu.:104.0   1st Qu.: 75.0   1st Qu.:2223
##  Median :23.00   Median :4.000   Median :146.0   Median : 93.5   Median :2800
##  Mean   :23.52   Mean   :5.458   Mean   :193.5   Mean   :104.5   Mean   :2970
##  3rd Qu.:29.00   3rd Qu.:8.000   3rd Qu.:262.0   3rd Qu.:126.0   3rd Qu.:3609
##  Max.   :46.60   Max.   :8.000   Max.   :455.0   Max.   :230.0   Max.   :5140
##                                                  NA's   :5
##   acceleration        year       origin      name
##  Min.   : 8.00   Min.   :70.00   1:248   Length:397
##  1st Qu.:13.80   1st Qu.:73.00   2: 70   Class :character
##  Median :15.50   Median :76.00   3: 79   Mode  :character
##  Mean   :15.56   Mean   :75.99
##  3rd Qu.:17.10   3rd Qu.:79.00
##  Max.   :24.80   Max.   :82.00
##
KNN
I find that horsepower contains 5 NA values. I can ignore the data points with horsepower NA, or I could impute the NA values using KNN or other methods. Before imputing, I want to make a strong case that my imputation would be right.
| mpg | cylinders | displacement | weight | acceleration | year | origin | name |
|---|---|---|---|---|---|---|---|
| 25.0 | 4 | 98 | 2046 | 19.0 | 71 | 1 | ford pinto |
| 21.0 | 6 | 200 | 2875 | 17.0 | 74 | 1 | ford maverick |
| 40.9 | 4 | 85 | 1835 | 17.3 | 80 | 2 | renault lecar deluxe |
| 23.6 | 4 | 140 | 2905 | 14.3 | 80 | 1 | ford mustang cobra |
| 34.5 | 4 | 100 | 2320 | 15.8 | 81 | 2 | renault 18i |
The assumption behind using KNN for missing values is that a point value can be approximated by the values of the points that are closest to it, based on other variables.
Let me take three variables from the above data set, mpg, acceleration and horsepower. Intuitively, these variables seem to be related.
ggplot(cars_info, aes(x = mpg, y = acceleration, color = horsepower)) +
  geom_point(show.legend = TRUE) +
  labs(x = 'Mpg', y='Acceleration',  title = "Auto MPG",
       color = 'Horsepower') +
  scale_color_gradient(low = "green", high = "red",
                       na.value = "blue", guide = "legend") +
  theme_minimal()+theme(legend.position="bottom")
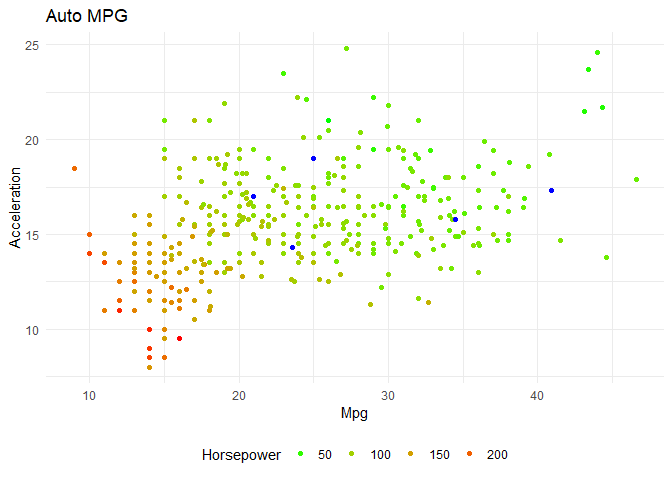
In the above plot, the blue colour points are null values. I can infer that cars of similar mpg and acceleration have similar horsepower. For a given missing value, I can look at the mpg of the car, its acceleration, look for its k nearest neighbours and get the car's horsepower.
I am using preprocess function in caret package for imputing NA's. The K value that I am taking is 20 (~ close to square root of number of variables)
Imputation using caret
library(caret)
preProcValues <- preProcess(cars_info %>%
                          dplyr::select(mpg, cylinders, displacement, weight, acceleration, origin, horsepower),
                            method = c("knnImpute"),
                            k = 20,
                            knnSummary = mean)
impute_cars_info <- predict(preProcValues, cars_info,na.action = na.pass)
The impute_cars_info data set will be normalized. To de-normalize and get the original data back:
procNames <- data.frame(col = names(preProcValues$mean), mean = preProcValues$mean, sd = preProcValues$std)
for(i in procNames$col){
 impute_cars_info[i] <- impute_cars_info[i]*preProcValues$std[i]+preProcValues$mean[i]
}
The imputed horsepower for the missing data points is:
| name | year | origin | mpg | cylinders | displacement | weight | acceleration | horsepower |
|---|---|---|---|---|---|---|---|---|
| ford maverick | 74 | 1 | 21.0 | 6 | 200 | 2875 | 17.0 | 93.60 |
| ford mustang cobra | 80 | 1 | 23.6 | 4 | 140 | 2905 | 14.3 | 94.95 |
| ford pinto | 71 | 1 | 25.0 | 4 | 98 | 2046 | 19.0 | 72.45 |
| renault 18i | 81 | 2 | 34.5 | 4 | 100 | 2320 | 15.8 | 73.75 |
| renault lecar deluxe | 80 | 2 | 40.9 | 4 | 85 | 1835 | 17.3 | 65.10 |
The actual hp for the cars is as follows:
| name | year | horsepower | actual_hp | difference |
|---|---|---|---|---|
| ford maverick | 74 | 93.60 | 84 | 9.60 |
| ford mustang cobra | 80 | 94.95 | 118 | 23.05 |
| ford pinto | 71 | 72.45 | 100 | 27.55 |
| renault 18i | 81 | 73.75 | 81 | 7.25 |
| renault lecar deluxe | 80 | 65.10 | 51 | 14.10 |
Out of the 5 cars, I was able to impute horsepower for 2 cars with less than 10hp difference, one car within 15hp and two cars within 30hp difference. To get better results, I should use other imputation techniques. Generally these 5 cars are removed while doing any analysis. In R, you could find the removed data set as mtcars.