Enterprise Chatbot
Building an Enterprise Agent Framework with LangGraph, SQL and RAG
Enterprise teams rarely keep knowledge in one place. Financial facts live in relational databases. Risk disclosures live in internal documents. Market signals change through public news feeds. When a user asks one business question, an AI system often needs all three.
This notebook shows how to build that system using LangGraph. We will create a stateful graph that can route a single query to SQL, RAG, and web search, then combine validated outputs into one response. We will also generate a visual summary when the query asks for it.
The implementation is practical. It uses Supabase for PostgreSQL and vector search, OpenAI for language and embeddings, and Serper for web results. The graph is explicit, inspectable, and testable. You can run each part and verify behaviour step by step.
Use case
A financial analyst asks, "What are the latest risks for TCS and how has net profit changed recently?" The system should pull structured metrics from SQL tables, gather risk context from internal documents, and add relevant market updates from external news. It should then return one response with clear evidence, and generate a chart if the query asks for trend visualisation.
Link: Enterprise Chatbot
Data sources used in this implementation
The following data is present and updated for the Indian Stock Market.
companies: company master with symbol and name.annual_financials: fiscal-year metrics such as revenue, operating profit, net profit, EPS, ROCE, and ROE.quarterly_financials: quarter-level revenue and profit metrics.stock_prices: daily OHLCV series for trend analysis.
What this notebook covers
- Environment and runtime setup through .env variables.
- A typed shared state for all graph nodes.
- Helper functions for SQL execution, retrieval, and chart generation.
- Node-level responsibilities and routing decisions.
- Graph wiring with conditional edges and retry behaviour.
- End-to-end execution patterns for enterprise questions.
Quick glossary
- Agent node: A focused function that does one task in the graph.
- State: Shared dictionary-like object passed between nodes.
- Router: Logic that decides which node to execute next.
- RAG: Retrieval-Augmented Generation using document chunks.
- Checkpointing: Persisting graph state between steps.
- Synthesis: Combining outputs from multiple sources into one answer.
Why this design works in enterprise settings
A graph structure is easier to govern than a single monolithic prompt. Each node can be tested independently. Failures can be isolated to one data source. Retries can be limited to specific steps. This gives better control over reliability and makes operations simpler when credentials, schemas, or APIs change.
import os
import json
import uuid
import re
from typing import TypedDict, Any, Optional, List, Dict
import pandas as pd
import plotly.express as px
from dotenv import load_dotenv
from sqlalchemy import create_engine, text
from supabase import create_client
from openai import OpenAI
from langgraph.graph import StateGraph, END
from langgraph.checkpoint.memory import MemorySaver
import plotly.io as pio
import requests

load_dotenv()

SUPABASE_URL = os.getenv("SUPABASE_URL")
SUPABASE_KEY = os.getenv("SUPABASE_KEY")
OPENAI_API_KEY = os.getenv("OPENAI_API_KEY")
SERPER_API_KEY = os.getenv("SERPER_API_KEY")
LLM_MODEL = os.getenv("LLM_MODEL", "gpt-4o-mini")

DB_USER = os.getenv("DB_USER")
DB_HOST = os.getenv("DB_HOST")
DB_PORT = int(os.getenv("DB_PORT", "5432"))
DB_NAME = os.getenv("DB_NAME", "postgres")
DB_PASSWORD = os.getenv("DB_PASSWORD")

required_env = {
    "SUPABASE_URL": SUPABASE_URL,
    "SUPABASE_KEY": SUPABASE_KEY,
    "OPENAI_API_KEY": OPENAI_API_KEY,
    "SERPER_API_KEY": SERPER_API_KEY,
    "DB_USER": DB_USER,
    "DB_HOST": DB_HOST,
    "DB_PASSWORD": DB_PASSWORD,
}
missing_env = [key for key, value in required_env.items() if not value]
if missing_env:
    raise ValueError(f"Missing required environment variables in .env: {', '.join(missing_env)}")

supabase = create_client(SUPABASE_URL, SUPABASE_KEY)
client = OpenAI(api_key=OPENAI_API_KEY)
engine = create_engine(
    f"postgresql+psycopg2://{DB_USER}:{DB_PASSWORD}@{DB_HOST}:{DB_PORT}/{DB_NAME}"
)

DETAILED_SCHEMA = """
Table: companies
- id (BIGINT, PRIMARY KEY)
- symbol (VARCHAR)
- company_name (VARCHAR)

Table: stock_prices
- company_id (BIGINT, FOREIGN KEY -> companies.id)
- trade_date (DATE)
- open (NUMERIC), high (NUMERIC), low (NUMERIC), close (NUMERIC), volume (BIGINT)

Table: annual_financials
- company_id (BIGINT, FOREIGN KEY -> companies.id)
- fiscal_year (INT)
- revenue (NUMERIC), expenses (NUMERIC), operating_profit (NUMERIC), net_profit (NUMERIC), eps (NUMERIC)

Table: quarterly_financials
- company_id (BIGINT, FOREIGN KEY -> companies.id)
- quarter_end (DATE)
- revenue (NUMERIC), expenses (NUMERIC), operating_profit (NUMERIC), net_profit (NUMERIC)
"""
import os
from dotenv import load_dotenv

load_dotenv()

langsmith_api_key = os.getenv("LANGSMITH_API_KEY") or os.getenv("LANGCHAIN_API_KEY")
langsmith_project = os.getenv("LANGSMITH_PROJECT", "Enterprise_Financial_Agent")

if langsmith_api_key:
    os.environ["LANGCHAIN_TRACING_V2"] = "true"
    os.environ["LANGCHAIN_API_KEY"] = langsmith_api_key
    os.environ["LANGCHAIN_PROJECT"] = langsmith_project
else:
    print("LANGSMITH_API_KEY (or LANGCHAIN_API_KEY) is not set in .env. Tracing is disabled.")
Managing the Agent State
LangGraph works best when state is explicit and typed. Instead of passing loose variables between steps, we maintain a single structured state object that captures the full lifecycle of a request.
In this notebook, the state tracks user input, routing flags, generated SQL, SQL outputs, document retrieval context, optional news context, chart JSON, retry counters, and final response text. This design gives three benefits.
First, traceability. You can inspect each field after execution and understand how the answer was formed. Second, resilience. If a node fails, you can preserve context and retry only that branch. Third, maintainability. New capabilities can be added by introducing new fields without rewriting the whole pipeline.
The state also acts as a contract between nodes. A node can rely on known keys and expected value types, which reduces hidden coupling. In production systems, this lowers debugging effort and improves confidence during version updates.
class AgentState(TypedDict, total=False):
    user_query: str
    chat_history: List[Dict[str, str]]
    routing_decision: Dict[str, Any]
    schema: str
    sql_plan: str
    sql_query: str
    verified_sql: str
    sql_result: Dict[str, Any]
    retrieved_docs: List[Dict[str, Any]]
    rag_context: str
    rag_answer: str
    external_context: str
    chart_json: Optional[str]
    validation_result: str
    final_response: str
    retry_count: int
    error: Optional[str]
Helper functions
This section contains the operational building blocks used by multiple nodes. Keeping these utilities separate makes the graph cleaner and easier to test.
clean_sql_query removes markdown wrappers from model output. This is useful when the model returns SQL inside fenced blocks. It ensures execution receives plain SQL.
run_sql executes the cleaned query through SQLAlchemy and returns a structured result dictionary. On success, it stores status, rows, columns, and executed query. On failure, it stores status and error message. This uniform shape is useful for downstream handling.
create_plotly_chart inspects returned records and builds a bar chart only when numeric columns are available. If the data is empty or non-numeric, it returns None rather than forcing a chart.
embed and vector_search support RAG. The first creates embeddings, and the second calls Supabase RPC (match_documents) to fetch nearest document chunks.
serper_search performs external search. It returns JSON payload from the API and gracefully handles failures. This allows the graph to continue even when news retrieval is unavailable.
In enterprise pipelines, these helper functions are where most runtime variation appears, such as credential issues, schema changes, API limits, or network errors. Returning standardised outputs from each helper is therefore essential for reliable orchestration.
def clean_sql_query(raw_query: str) -> str:
    cleaned = re.sub(r"^```(?:sql)?\s*", "", raw_query.strip(), flags=re.IGNORECASE)
    cleaned = re.sub(r"\s*```$", "", cleaned)
    return cleaned.strip()

def run_sql(sql: str) -> Dict[str, Any]:
    cleaned_sql = clean_sql_query(sql)
    try:
        with engine.connect() as conn:
            df = pd.read_sql(text(cleaned_sql), conn)

        return {
            "status": "success",
            "data": df.to_dict(orient="records"),
            "columns": df.columns.tolist(),
            "query": cleaned_sql
        }
    except Exception as e:
        return {
            "status": "error",
            "error": str(e),
            "query": cleaned_sql
        }

def create_plotly_chart(records: List[Dict[str, Any]]) -> Optional[str]:
    if not records:
        return None

    df = pd.DataFrame(records)
    num_cols = df.select_dtypes(include="number").columns.tolist()
    if not num_cols:
        return None

    x_col = df.columns[0]
    y_col = num_cols[0]
    fig = px.bar(df, x=x_col, y=y_col, title=f"{y_col} across {x_col}")
    return fig.to_json()

def embed(text: str) -> List[float]:
    response = client.embeddings.create(
        model="text-embedding-3-small",
        input=text
    )
    return response.data[0].embedding

def vector_search(question: str, top_k: int = 5) -> List[Dict[str, Any]]:
    try:
        query_embedding = embed(question)
        response = supabase.rpc(
            "match_documents",
            {
                "query_embedding": query_embedding,
                "match_count": top_k
            }
        ).execute()
        return response.data or []
    except Exception as e:
        print(f"Vector search error: {e}")
        return []

def serper_search(query: str) -> Dict[str, Any]:
    if not SERPER_API_KEY:
        return {}
    try:
        response = requests.post(
            "https://google.serper.dev/search",
            headers={
                "X-API-KEY": SERPER_API_KEY,
                "Content-Type": "application/json"
            },
            json={"q": query},
            timeout=15
        )
        return response.json()
    except Exception as e:
        print(f"Search API error: {e}")
        return {}
Designing the Nodes
The graph uses specialised nodes, where each node has one clear responsibility.
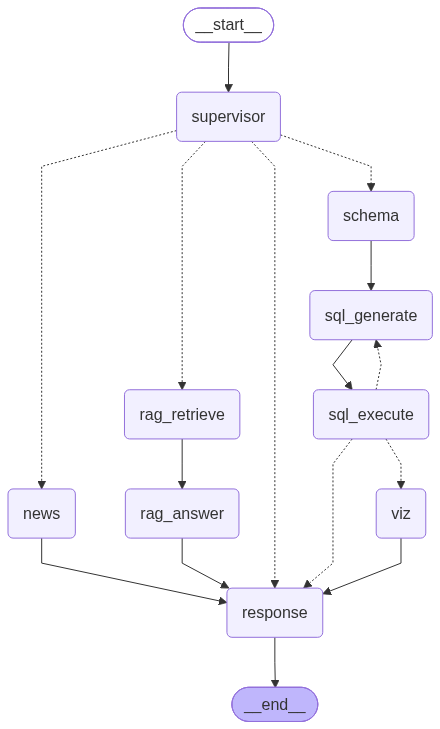
supervisor is the control layer. It analyses the user query and emits routing flags for SQL, RAG, news, and visualisation requirements.
schema_node injects a concise schema description into state. This helps SQL generation stay grounded in available tables and columns.
SQL Agent
The SQL agent path is the core for numeric business answers. It is implemented as a sequence of focused steps.
schema_nodeprovides table and column context to reduce invalid query generation.sql_generateconverts user intent to executable PostgreSQL SQL.sql_executeruns the query and returns a structured payload with status, columns, records, and executed query text.- If execution fails, retry logic sends control back to
sql_generatewith error context, up to the configured limit. - If execution succeeds and charting is requested,
viz_nodeconverts numeric output into Plotly JSON for rendering.
This explicit SQL path matters because SQL is where most factual financial outputs come from. It also gives a clear audit trail for how a metric answer was computed.
rag_retrieve fetches related internal documents, and rag_answer_node converts those passages into a focused answer. This allows internal knowledge to complement tabular facts.
news_node fetches recent external context. This is useful for market-sensitive prompts where recent events may influence interpretation.
viz_node generates chart JSON from SQL records when numerical data is present and visualisation is requested.
response_node synthesises all available contexts into one coherent answer. It is the final integration point and should only use retrieved evidence.
This decomposition matters. If one data source fails, others can still contribute. It also improves observability because each node’s output can be inspected independently in graph traces.
def llm(prompt: str, json_mode: bool = False) -> str:
    kwargs = {"model": LLM_MODEL, "messages": [{"role": "user", "content": prompt}]}
    if json_mode:
        kwargs["response_format"] = {"type": "json_object"}
    response = client.chat.completions.create(**kwargs)
    return response.choices[0].message.content

def supervisor(state: AgentState) -> dict:
    prompt = f"""
    Analyse the user query and decide which tools are required.
    Query: {state['user_query']}

    Return a JSON object with boolean flags:
    {{
      "needs_sql": true/false,
      "needs_rag": true/false,
      "needs_news": true/false,
      "needs_viz": true/false
    }}
    """
    decision = json.loads(llm(prompt, json_mode=True))
    return {
        "routing_decision": decision,
        "retry_count": 0
    }

def schema_node(state: AgentState) -> dict:
    return {"schema": DETAILED_SCHEMA}

def sql_generate(state: AgentState) -> dict:
    error_context = f"\nPrevious error: {state.get('error')}" if state.get("error") else ""
    prompt = f"""
    Write a single PostgreSQL query to answer the user query.
    Schema:
    {state.get('schema', DETAILED_SCHEMA)}

    User Query: {state['user_query']}
    {error_context}

    Rules:
    - Never use placeholders like <TCS_id>. Use subqueries or JOINs.
    - Return ONLY the executable SQL query. Do not wrap in markdown or add explanations.
    """
    cleaned_query = clean_sql_query(llm(prompt))
    return {"sql_query": cleaned_query}

def sql_execute(state: AgentState) -> dict:
    result = run_sql(state["sql_query"])
    if result["status"] == "error":
        return {
            "sql_result": result,
            "error": result["error"],
            "retry_count": state.get("retry_count", 0) + 1
        }
    return {
        "sql_result": result,
        "error": None
    }

def viz_node(state: AgentState) -> dict:
    sql_res = state.get("sql_result")
    chart_json = None
    if sql_res and sql_res.get("status") == "success":
        chart_json = create_plotly_chart(sql_res.get("data", []))
    return {"chart_json": chart_json}

def rag_retrieve(state: AgentState) -> dict:
    docs = vector_search(state["user_query"], top_k=5)
    context = "\n\n".join([d.get("content", "") for d in docs])
    return {
        "retrieved_docs": docs,
        "rag_context": context
    }

def rag_answer_node(state: AgentState) -> dict:
    prompt = f"""
    Answer the question using the retrieved context.
    Context:
    {state.get('rag_context', '')}

    Question: {state['user_query']}
    """
    answer = llm(prompt)
    return {"rag_answer": answer}

def news_node(state: AgentState) -> dict:
    try:
        search_data = serper_search(state["user_query"])
        context = json.dumps(search_data)[:5000]
    except Exception:
        context = ""
    return {"external_context": context}

def response_node(state: AgentState) -> dict:
    data_context = []

    sql_res = state.get("sql_result", {})
    if sql_res.get("status") == "success" and sql_res.get("data"):
        df_text = pd.DataFrame(sql_res["data"]).to_string(index=False)
        data_context.append(f"SQL Data:\n{df_text}")

    if state.get("rag_answer"):
        data_context.append(f"Internal Document Knowledge:\n{state['rag_answer']}")

    if state.get("external_context"):
        data_context.append(f"Recent News:\n{state['external_context']}")

    has_chart = bool(state.get("chart_json"))
    chart_instruction = (
        "Note: An interactive chart has already been generated and rendered for the user. "
        "Do not write Python code, and do not tell the user to plot the chart themselves. "
        "Provide a concise summary and financial commentary based on the data points."
        if has_chart
        else ""
    )

    prompt = f"""
    You are an enterprise financial assistant. Synthesise a clear response to the user query using the provided data sources.

    User Query: {state['user_query']}

    Data Sources:
    {"\n\n".join(data_context)}

    {chart_instruction}
    """
    final_resp = llm(prompt)
    return {"final_response": final_resp}
Wiring the Graph
This is where node logic becomes execution flow. LangGraph lets us define this explicitly through edges and conditional branches.
The graph starts at supervisor. Based on routing flags, execution branches to one or more retrieval paths.
- SQL path:
schema -> sql_generate -> sql_execute, followed by retry logic when execution fails. - RAG path:
rag_retrieve -> rag_answer. - News path:
news. - Optional visualisation path:
sql_execute -> vizwhen chart output is requested.
All active branches converge at response, which creates the final answer. The flow ends at END.
The retry rule for SQL is practical. If SQL fails, the system returns to sql_generate with error context and retries up to a limit. This reduces failures caused by small query mistakes while preventing infinite loops.
Finally, the graph is compiled with memory checkpointing. In notebook runs, this helps keep thread-specific state across invocations and supports iterative testing.
graph = StateGraph(AgentState)

# Add Nodes
graph.add_node("supervisor", supervisor)
graph.add_node("schema", schema_node)
graph.add_node("sql_generate", sql_generate)
graph.add_node("sql_execute", sql_execute)
graph.add_node("viz", viz_node)
graph.add_node("rag_retrieve", rag_retrieve)
graph.add_node("rag_answer", rag_answer_node)
graph.add_node("news", news_node)
graph.add_node("response", response_node)

# Routing Logic
def route_from_supervisor(state: AgentState) -> List[str]:
    decision = state.get("routing_decision", {})
    targets = []
    if decision.get("needs_sql"):
        targets.append("schema")
    if decision.get("needs_rag"):
        targets.append("rag_retrieve")
    if decision.get("needs_news"):
        targets.append("news")
    return targets if targets else ["response"]

def check_sql_status(state: AgentState) -> str:
    if state.get("sql_result", {}).get("status") == "error" and state.get("retry_count", 0) < 3:
        return "sql_generate"
    if state.get("routing_decision", {}).get("needs_viz"):
        return "viz"
    return "response"

# Graph Edges
graph.set_entry_point("supervisor")

graph.add_conditional_edges(
    "supervisor",
    route_from_supervisor,
    {
        "schema": "schema",
        "rag_retrieve": "rag_retrieve",
        "news": "news",
        "response": "response"
    }
)

graph.add_edge("schema", "sql_generate")
graph.add_edge("sql_generate", "sql_execute")
graph.add_conditional_edges("sql_execute", check_sql_status, {
    "sql_generate": "sql_generate",
    "viz": "viz",
    "response": "response"
})
graph.add_edge("viz", "response")

graph.add_edge("rag_retrieve", "rag_answer")
graph.add_edge("rag_answer", "response")

graph.add_edge("news", "response")
graph.add_edge("response", END)

app = graph.compile(checkpointer=MemorySaver())
from IPython.display import Image, display

try:
    # Get the graph and render it as a PNG image
    image_data = app.get_graph().draw_mermaid_png()
    display(Image(image_data))
except Exception as e:
    print("Required dependencies for plotting are missing.")
Executing Queries and Interpreting Results
The final stage is runtime behaviour. We invoke the compiled graph with a user query and thread configuration. The graph then routes work to relevant data sources and returns a structured state object.
The three sample runs below demonstrate typical enterprise scenarios.
- Hybrid query: internal risk context plus financial performance.
- News-focused query: recent external developments.
- Metric-focused query: net profit trend with optional chart output.
When reviewing outputs, check both the final response and intermediate fields in state.
sql_result: confirms whether SQL executed and returned rows.retrieved_docsandrag_context: show internal retrieval coverage.external_context: shows external search payload.chart_json: confirms whether visualisation was generated.
Practical troubleshooting
If a branch is empty or fails, diagnose source-by-source.
- SQL issues: verify table names, company matching logic, and date filters.
- RAG issues: verify embeddings model, RPC function, and document availability.
- News issues: verify Serper key validity and API response status.
- Auth issues: ensure all credentials are loaded from
.envbefore invocation.
A robust pattern is to keep responses evidence-led. When a source returns no data, the system should state that clearly instead of inferring numbers. This improves trust and makes operational debugging faster.
The code in this notebook stays unchanged. The value comes from clear orchestration, explicit state, and disciplined source handling.
config = {
    "configurable": {
        "thread_id": "user_01"
    }
}

result = app.invoke(
    {
        "user_query": "What are TCS risks and how did it perform in the last year?",
        "chat_history": []
    },
    config=config
)
print(result['final_response'])
# Display the interactive chart in the notebook
if result.get("chart_json"):
    fig = pio.from_json(result["chart_json"])
    fig.show()
**Tata Consultancy Services (TCS) Risks and Performance Overview**

**Risks:**
TCS faces several risks that could impact its business and financial performance:

1. **Market Volatility**: TCS has reported a decline in share prices, with an approximate drop of 20.5% in 2023, which reflects broader market trends and economic conditions affecting the IT sector.

2. **Economic Uncertainty**: Economic downturns and changing market demands can lead to reduced client budgets, impacting TCS’s revenue generation capacity.

3. **Technological Disruption**: The rise of artificial intelligence and other technological advancements poses a risk as they may alter the nature of IT services and disrupt existing business models.

4. **Competition**: The IT services market is highly competitive, with numerous players contributing to pricing pressures and the need for continuous innovation.

5. **Geopolitical Risks**: TCS operates globally, and geopolitical tensions can affect operations, particularly in regions where it has significant exposure.

**Performance in the Last Year:**
Over the past year, TCS experienced notable challenges:

- TCS reported a rare annual revenue drop, contrasting with historical growth, and saw its share prices decline significantly. In previous years, TCS's earnings per share had grown by about 4% annually, but these were not reflected in the company's share price, which has fallen by 16% over the same period.

- The company's financial performance was further impacted by concerns about AI-led disruptions and broader market dynamics.

For more detailed insights, you can visit related articles on [TCS's risks and financial performance](https://www.tcs.com/insights/blogs/risk-management-financial-planning-analysis) and the recent performance analysis [here](https://www.reuters.com/world/india/indias-tcs-shares-fall-rare-annual-revenue-drop-overshadows-quarterly-beat-2026-04-10/).
config = {
    "configurable": {
        "thread_id": "user_2"
    }
}

result = app.invoke(
    {
        "user_query": "What are some latest news about TCS?",
        "chat_history": []
    },
    config=config
)
print(result['final_response'])
# Display the interactive chart in the notebook
if result.get("chart_json"):
    fig = pio.from_json(result["chart_json"])
    fig.show()
Here are some of the latest news highlights about Tata Consultancy Services (TCS):

1. **Acquisition of Porsche IT Unit**: TCS has signed a significant agreement to acquire Porsche's IT unit, valued at approximately $1.46 billion. This deal is part of TCS's strategy to expand its offerings and capabilities within the automotive sector. [Read more here](https://www.reuters.com/company/tata-consultancy-services-ltd/).

2. **Launch of Agentic AI Platform**: TCS recently launched its Agentic AI platform aimed at transforming the drug development process. This innovation is part of the company's ongoing efforts to enhance its AI capabilities and deliver better solutions in healthcare. [View the announcement here](https://www.tcs.com/who-we-are/newsroom).

3. **Recent Press Releases**: TCS has been actively updating its newsroom with various press releases, highlighting new projects and corporate initiatives, including their first deal worth $1 billion. For more information, you can visit their [newsroom](https://www.tcs.com/who-we-are/newsroom).

4. **Corporate News**: TCS's corporate updates include upcoming events, significant contracts, and various business solutions, which are detailed on their [news alert page](https://www.tcs.com/who-we-are/newsroom/news-alert).

5. **Stock and Market Updates**: The latest updates regarding TCS's stock performance and financial information can be found on finance platforms, helping investors make informed decisions. [Check recent stock news here](https://nz.finance.yahoo.com/quote/TCS.BO/news/).

For further details about ongoing projects and potential employee-related news, consider visiting the provided links or following TCS's updates regularly.
config = {
    "configurable": {
        "thread_id": "user_3"
    }
}

result = app.invoke(
    {
        "user_query": "Plot the net profit of TCS for the last two years?",
        "chat_history": []
    },
    config=config
)
print(result['final_response'])
# Display the interactive chart in the notebook
if result.get("chart_json"):
    fig = pio.from_json(result["chart_json"])
    fig.show()
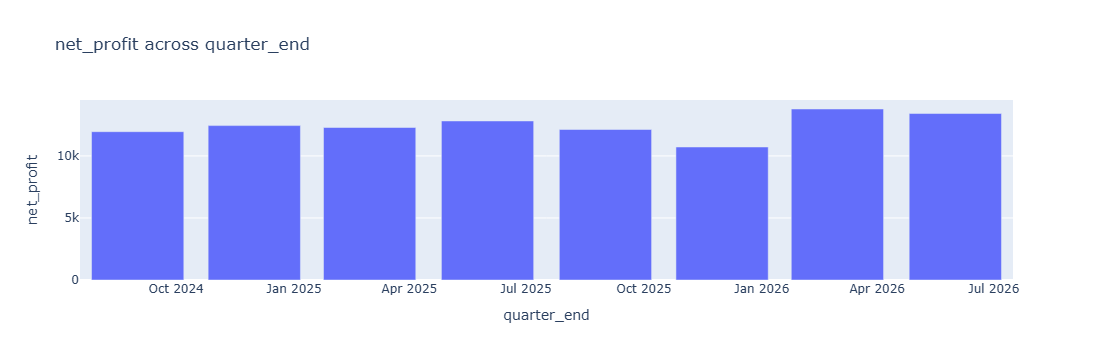
In the last two years, TCS has shown a steady fluctuation in its net profit figures. Below is a summary of net profit for the key quarters:

- **2024**:
  - September: 11,955 million
  - December: 12,444 million

- **2025**:
  - March: 12,293 million
  - June: 12,819 million
  - September: 12,131 million
  - December: 10,720 million

Looking at this data, TCS experienced an upward trend in net profit from September 2024 to June 2025, peaking at 12,819 million in June. However, there was a notable decline in December 2025, where net profit dropped to 10,720 million, indicating some variances in performance.

This summary suggests that while TCS has been able to generate substantial profits, the observed dip in late 2025 may warrant further analysis into cost management or market dynamics that could have influenced the profit decline.
Conclusion
This notebook presents a practical enterprise agent pattern using LangGraph, SQL, RAG, and external search. The key strength is controlled orchestration across heterogeneous sources with clear state transitions.
The implementation is modular. Each node has one job. Routing is explicit. Retries are bounded. Outputs are inspectable. That combination makes the system easier to audit and maintain in real business environments.
For production hardening, focus on four areas.
- Source reliability checks and proactive health monitoring.
- Tighter SQL generation constraints for schema-safe querying.
- Better retrieval quality controls for document search.
- Response policies that avoid unsupported claims when data is missing.
If you keep these principles in place, the same framework can scale from single-company analysis to broader enterprise knowledge workflows with strong operational clarity.